Customer journeys
The project aimed to improve journeys by increasing capacity, reducing congestion and making journey times more reliable. This page summarises how customer journeys have changed during the first three years after opening.
Journey times have reduced on key sections of the route, journeys have become more reliable and traffic is flowing more consistently despite the introduction of a lower speed limit. Although traffic volumes have generally been lower than forecast, the project has delivered measurable benefits for road users.
Traffic growth
How did traffic volumes change?
Three years after opening, traffic volumes on most sections of the A500 were lower than before the project and lower than would have been expected without the project. One exception was the northbound section between Etruria roundabout and Wolstanton junction, where traffic increased following the opening of the Etruria Valley Link Road (EVLR), providing a new route into the Etruria Valley Enterprise Area.
How did traffic growth compare with forecasts?
Observed traffic volumes varied across the route. Traffic was higher than forecast between Etruria roundabout and Wolstanton junction, but lower than forecast between Wolstanton junction and Porthill roundabout.
These differences are likely to reflect wider changes in travel demand following the COVID-19 pandemic together with the opening of the EVLR, which changed how traffic accesses the surrounding area. Overall, the evidence indicates that travel patterns have evolved differently from those assumed during the original appraisal.
The figures below compare observed and forecast traffic growth.
Forecast and observed change in traffic volume (three years after opening)
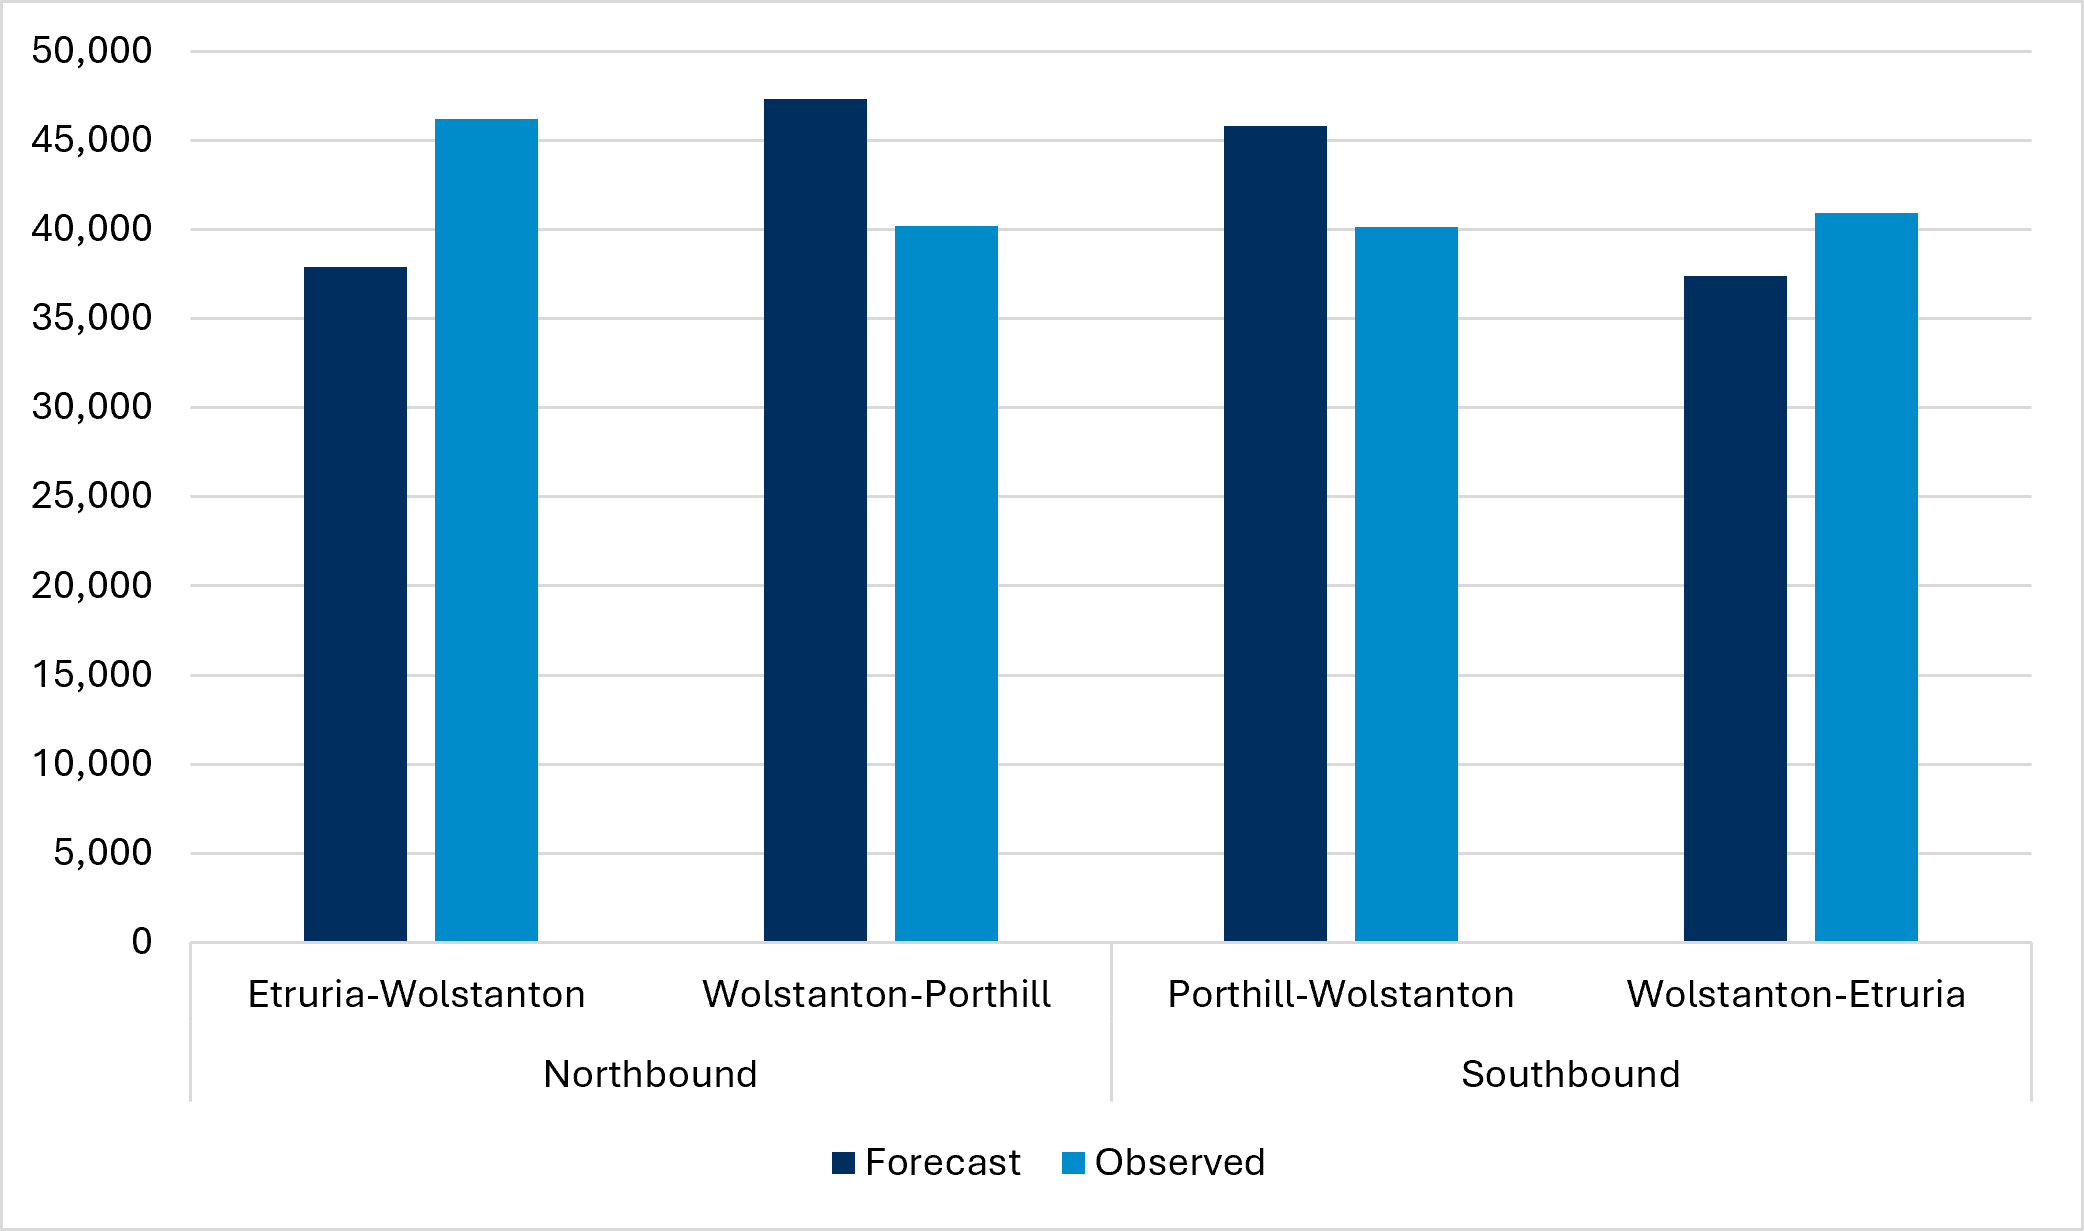
Source: Traffic Forecasting Report (TFR) and National Highways National Traffic Information Service (NTIS) Data. Forecast: 2023 and observed: 2023.
Journey time
Did the project reduce journey times?
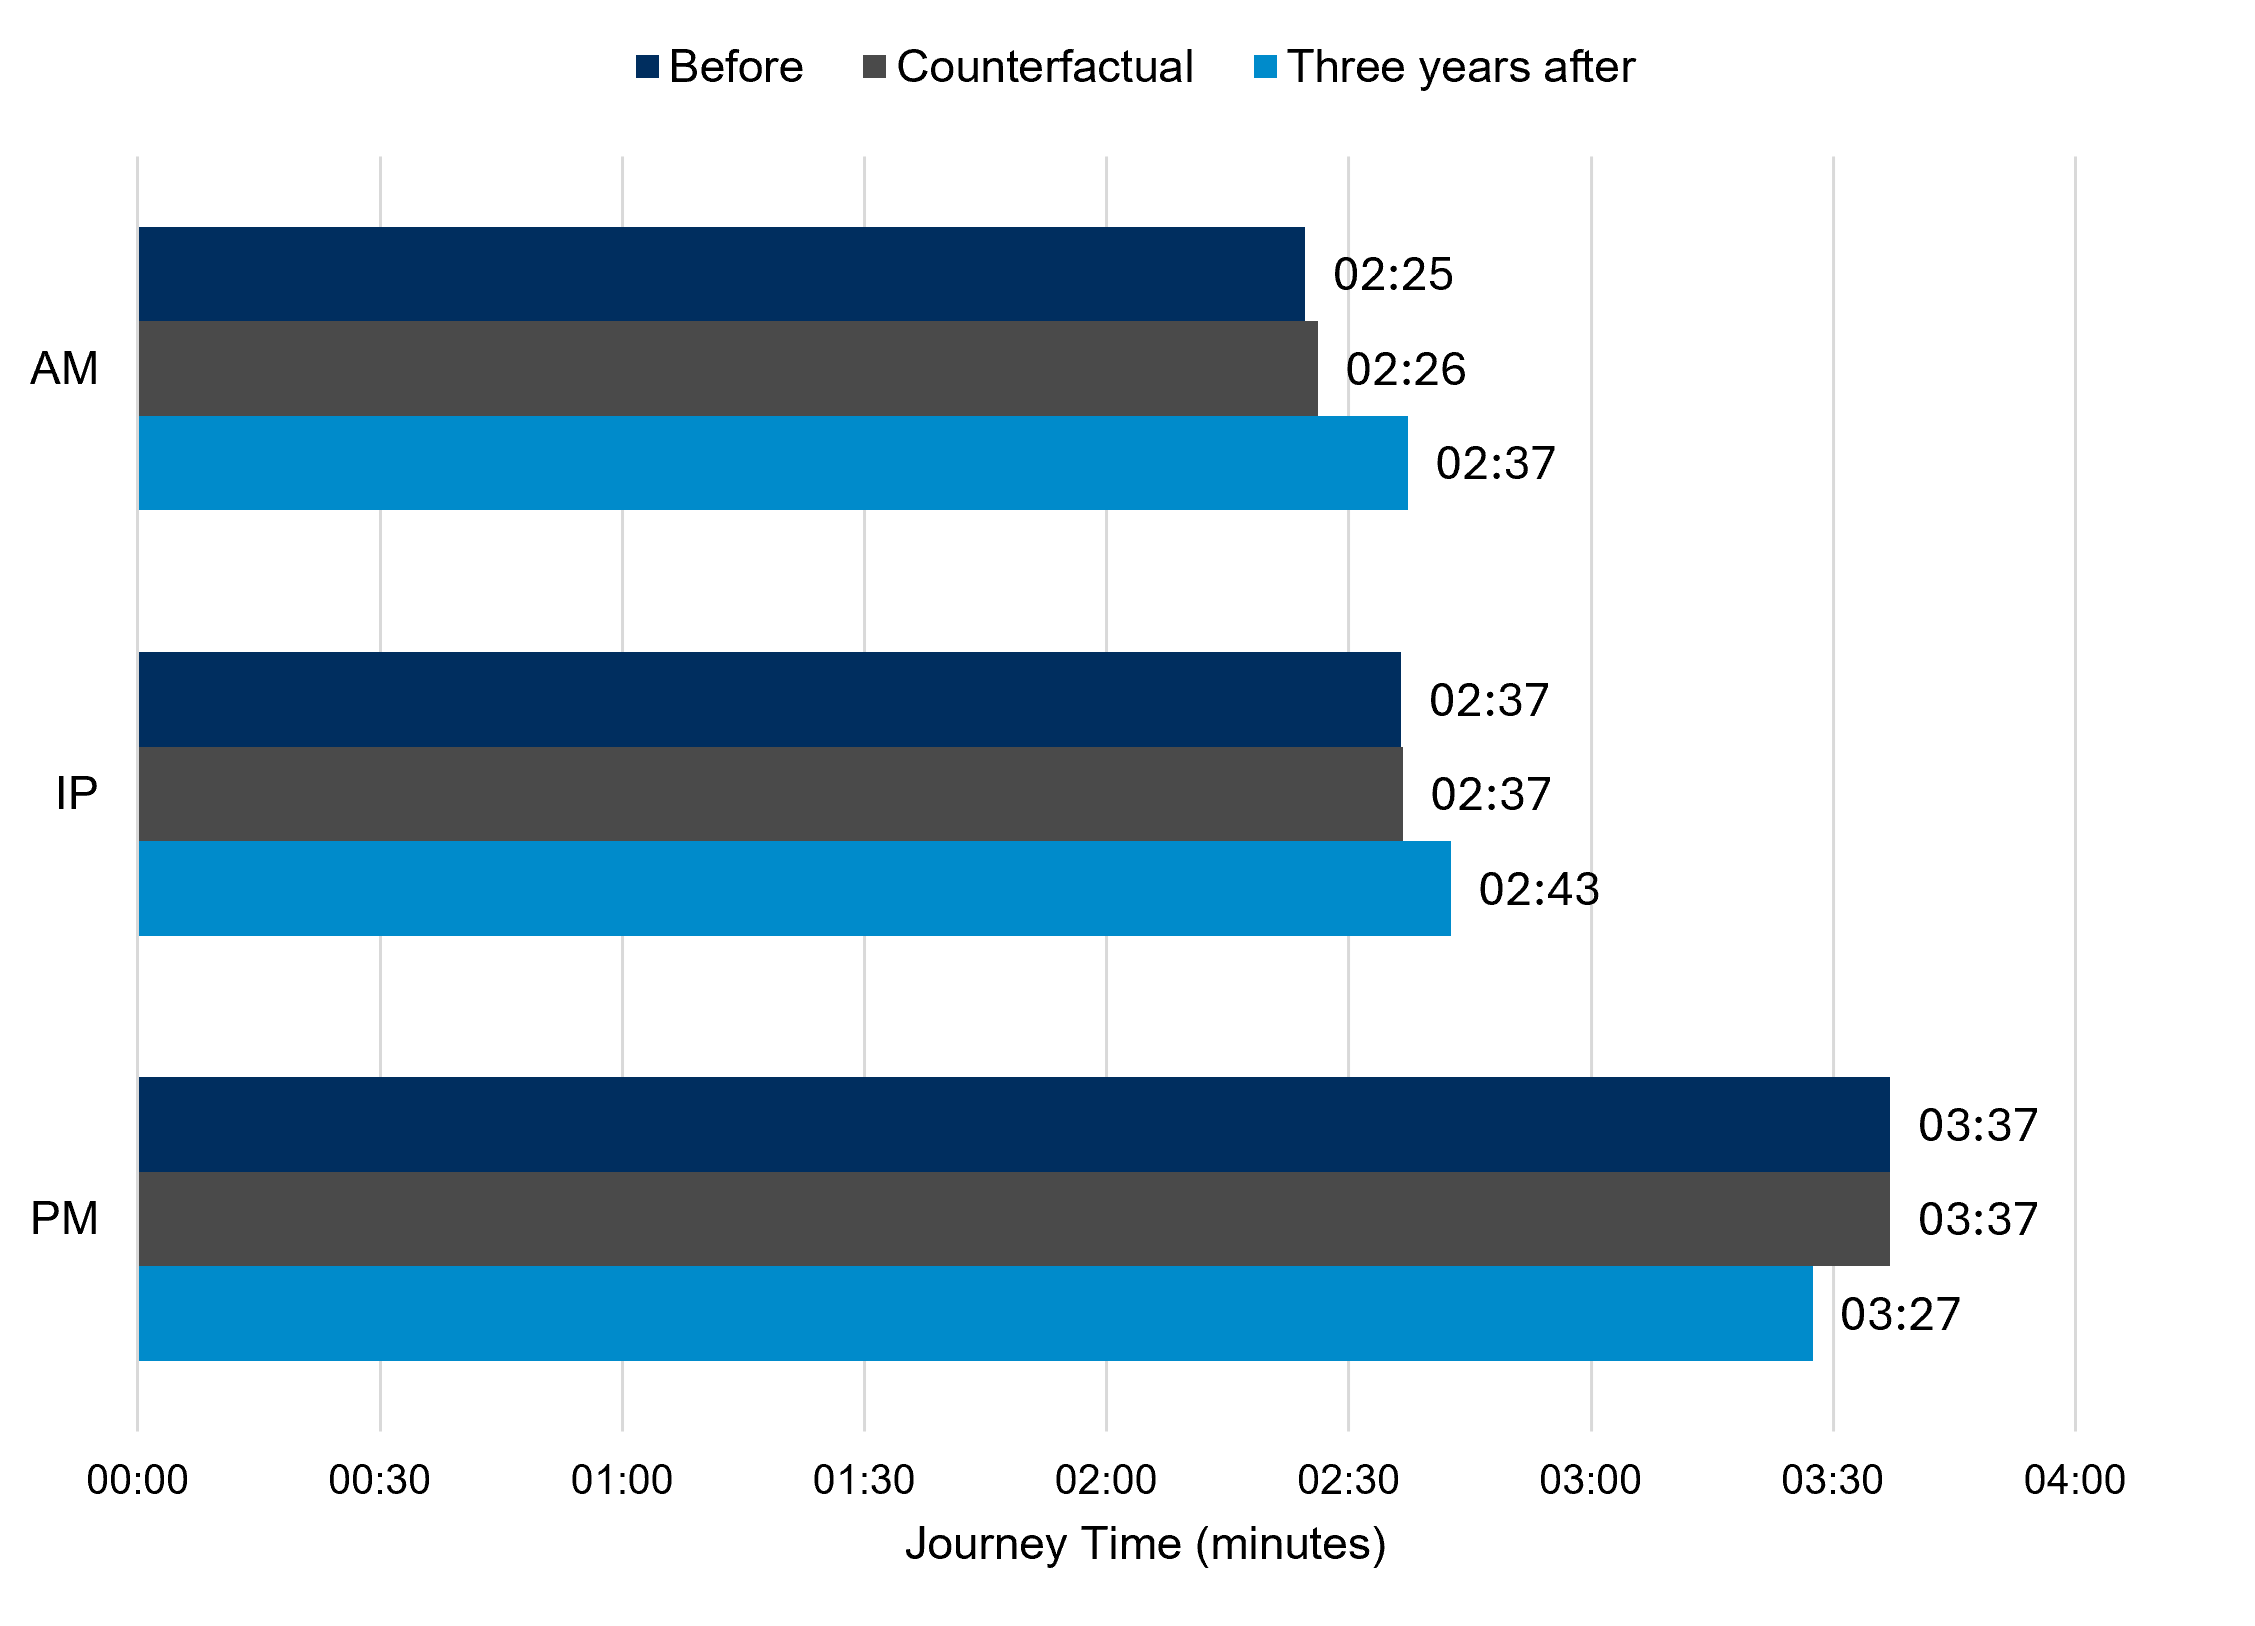
The project has delivered journey time improvements on key sections of the A500.
Southbound journeys were quicker during both the morning and evening peaks than before the project and the counterfactual. Northbound journey times were slightly longer, reflecting changes in traffic movements following the opening of the EVLR and the reduction in the speed limit from 70mph to 50mph along the corridor.
The figures below compare journey times across all time periods (morning peak, interpeak and evening peak) before the project, three years after opening and the counterfactual scenario.
Counterfactual comparison for journey times – northbound
Counterfactual comparison for journey times – southbound
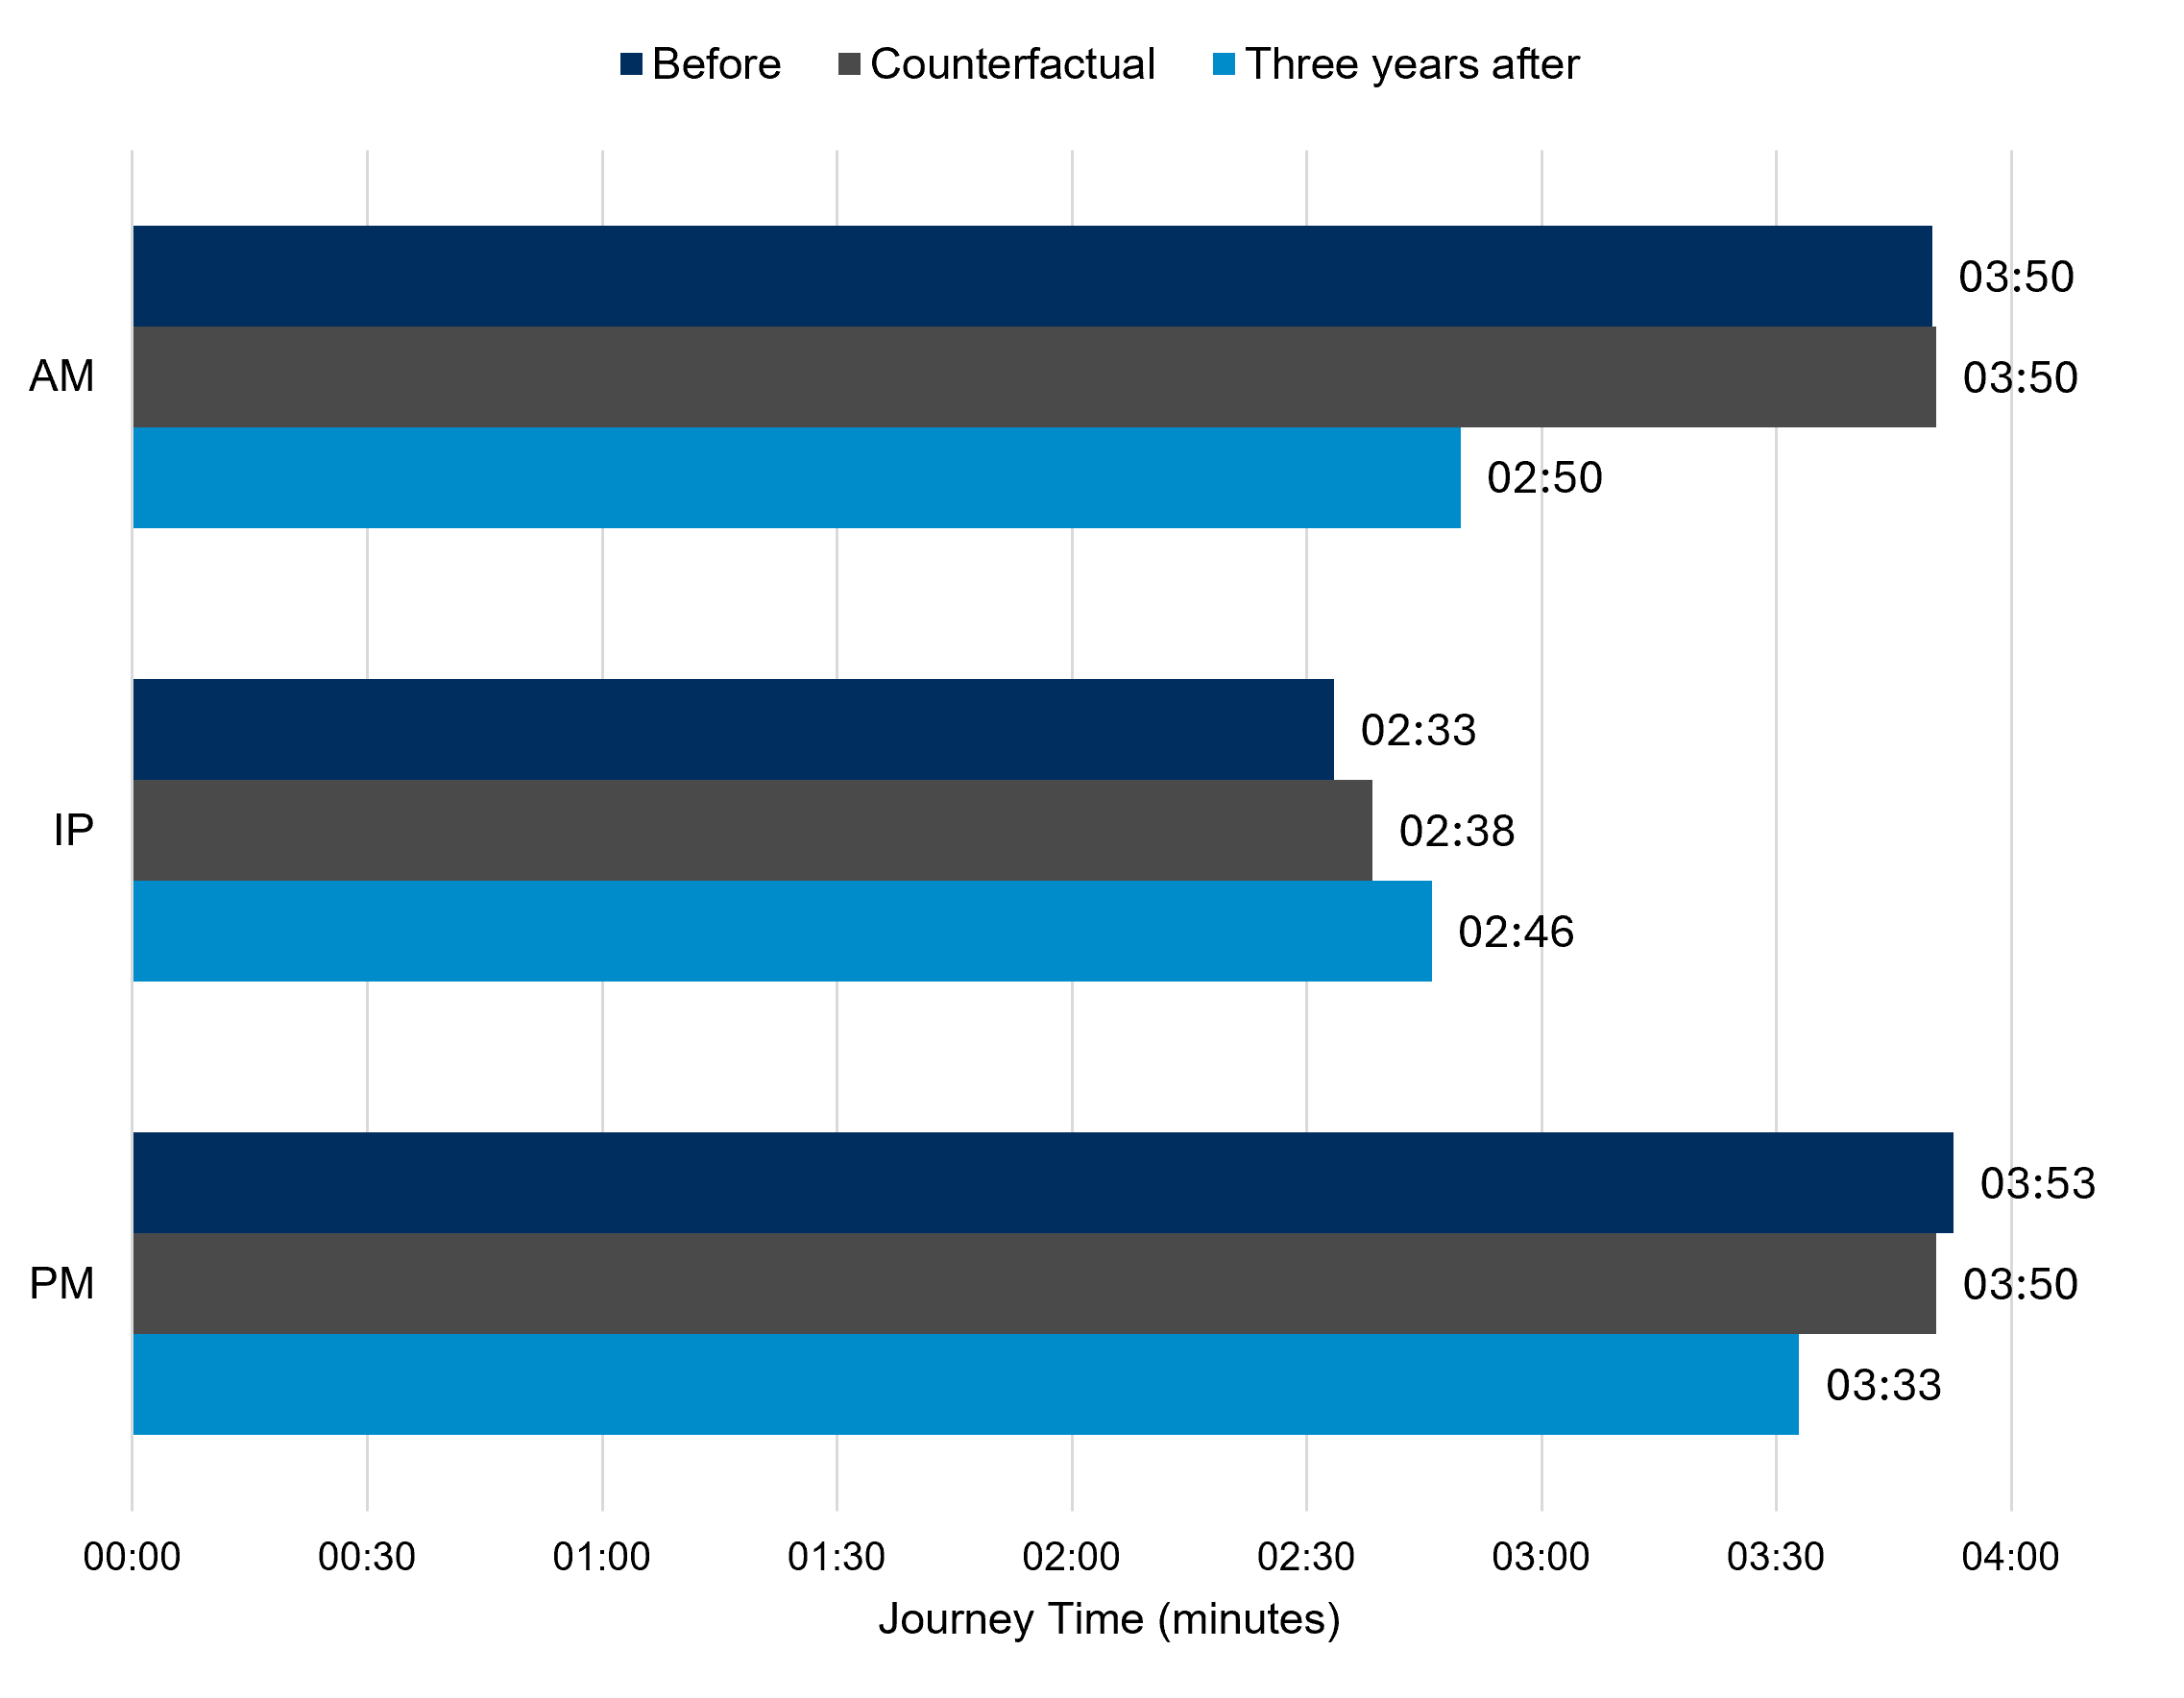 Source: Satellite Navigation (TomTom) and National Highways (NTIS). Before: 2017 and three years after: 2023.
How did journey time savings compare with expectations?
The appraisal forecasts differed from the outcomes observed. While the project delivered journey time improvements, particularly southbound, the realised benefits were smaller than forecast in the original business case. Forecasts also understated the journey times that would have occurred without the project. These differences are likely to reflect changes in traffic demand and network conditions since appraisal.
How did the project affect vehicle speeds?
Average speeds generally increased in the southbound direction, particularly during the morning and evening peaks, reflecting reduced congestion and smoother traffic flow. In the northbound direction, average speeds were slightly lower than before the project. This is likely to reflect changes in traffic patterns following the opening of the EVLR, together with the reduction in the speed limit from 70mph to 50mph along this section of the route.
The additional lane capacity reduced stop-start traffic and created smoother traffic flow, particularly during the busiest periods. This resulted in more uniform vehicle speeds and contributed to improved journey reliability for road users.
Journey time reliability
Did the project make journeys more reliable?
Reliable journeys are important for both local traffic and longer-distance users of the strategic road network. Three years after opening, journey time reliability improved in both directions across all time periods. The greatest improvements were observed during the morning peak, with southbound journeys becoming noticeably more consistent. Overall, the evidence shows the project has made journeys more predictable and reduced congestion on this section of the A500.
Journey time reliability – northbound
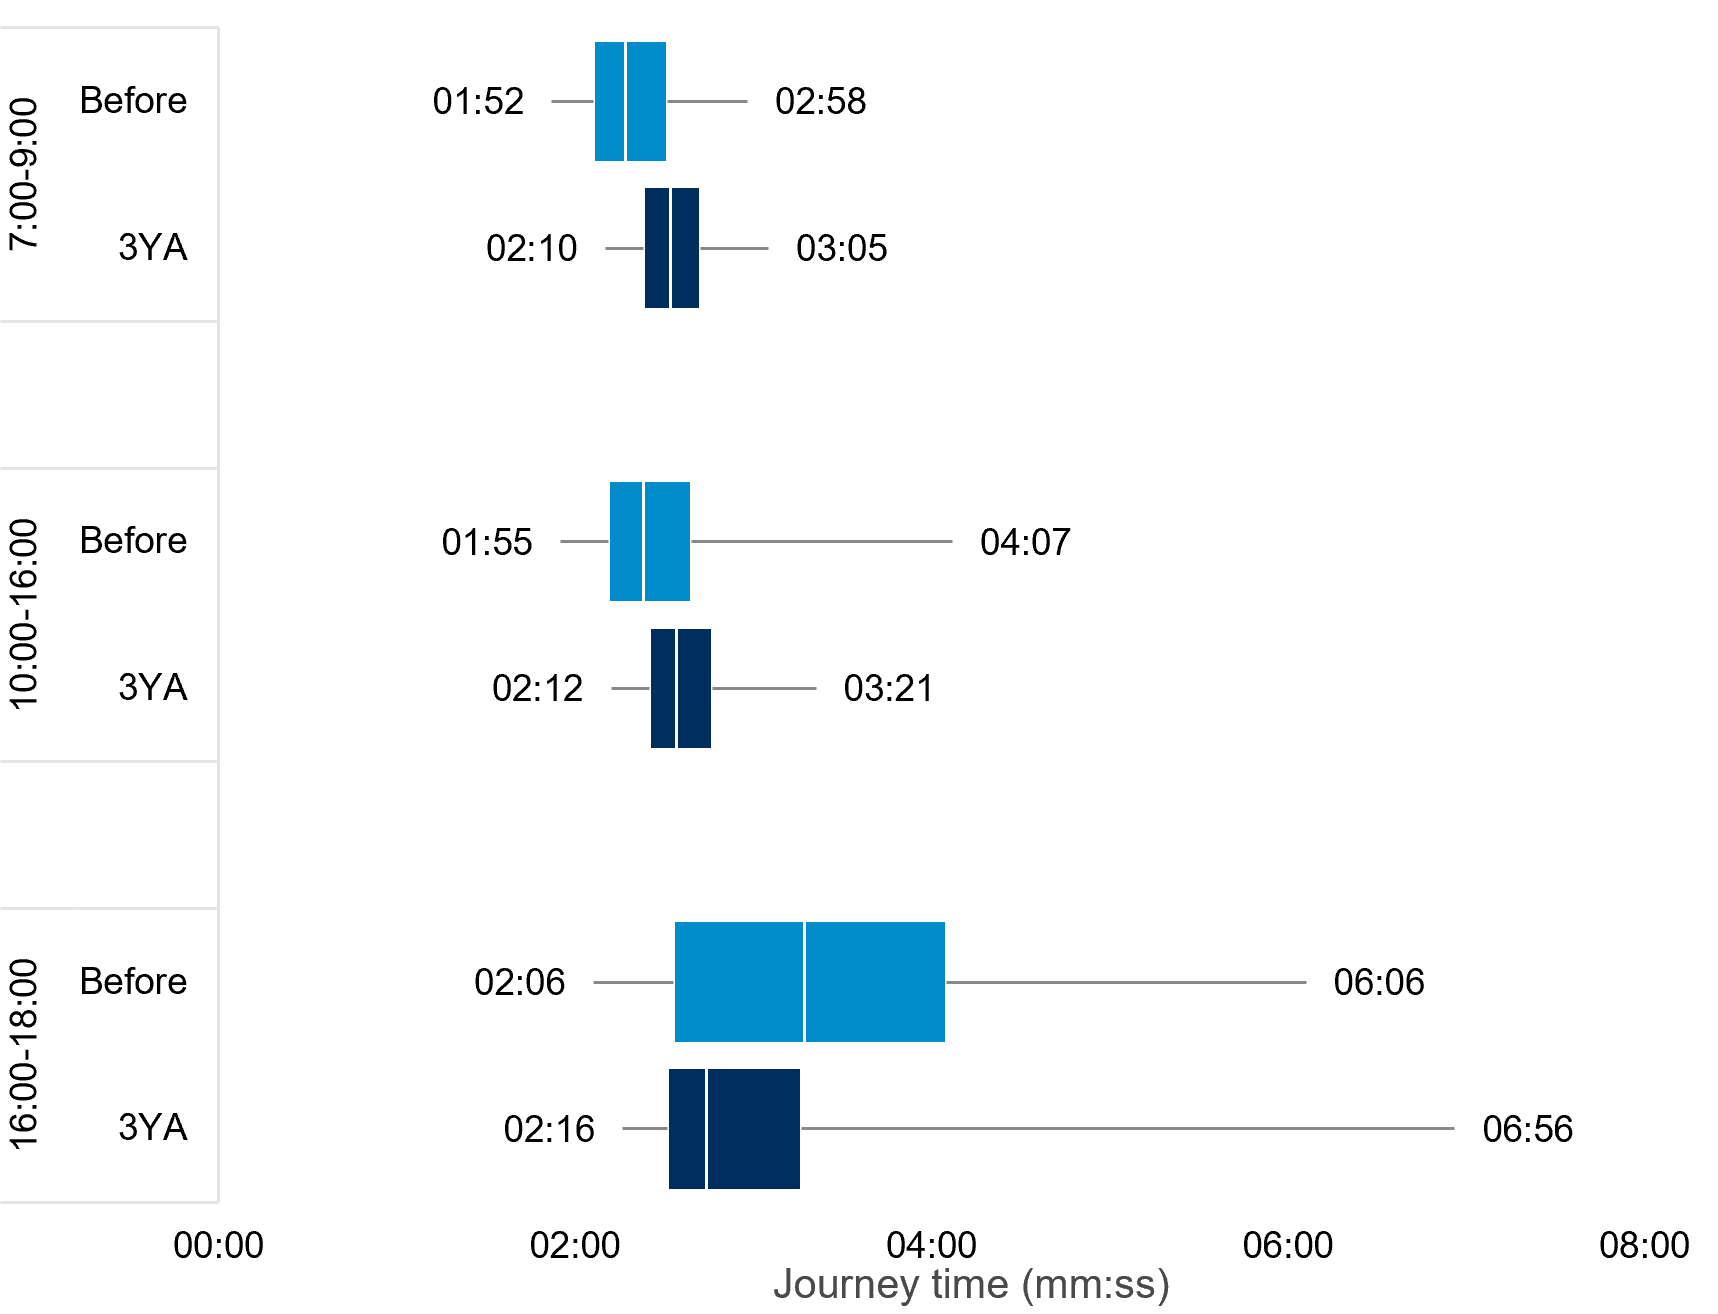 Source: Satellite Navigation (TomTom) and National Highways (NTIS). Before: 2017 and three years after: 2023.
Journey time reliability – southbound
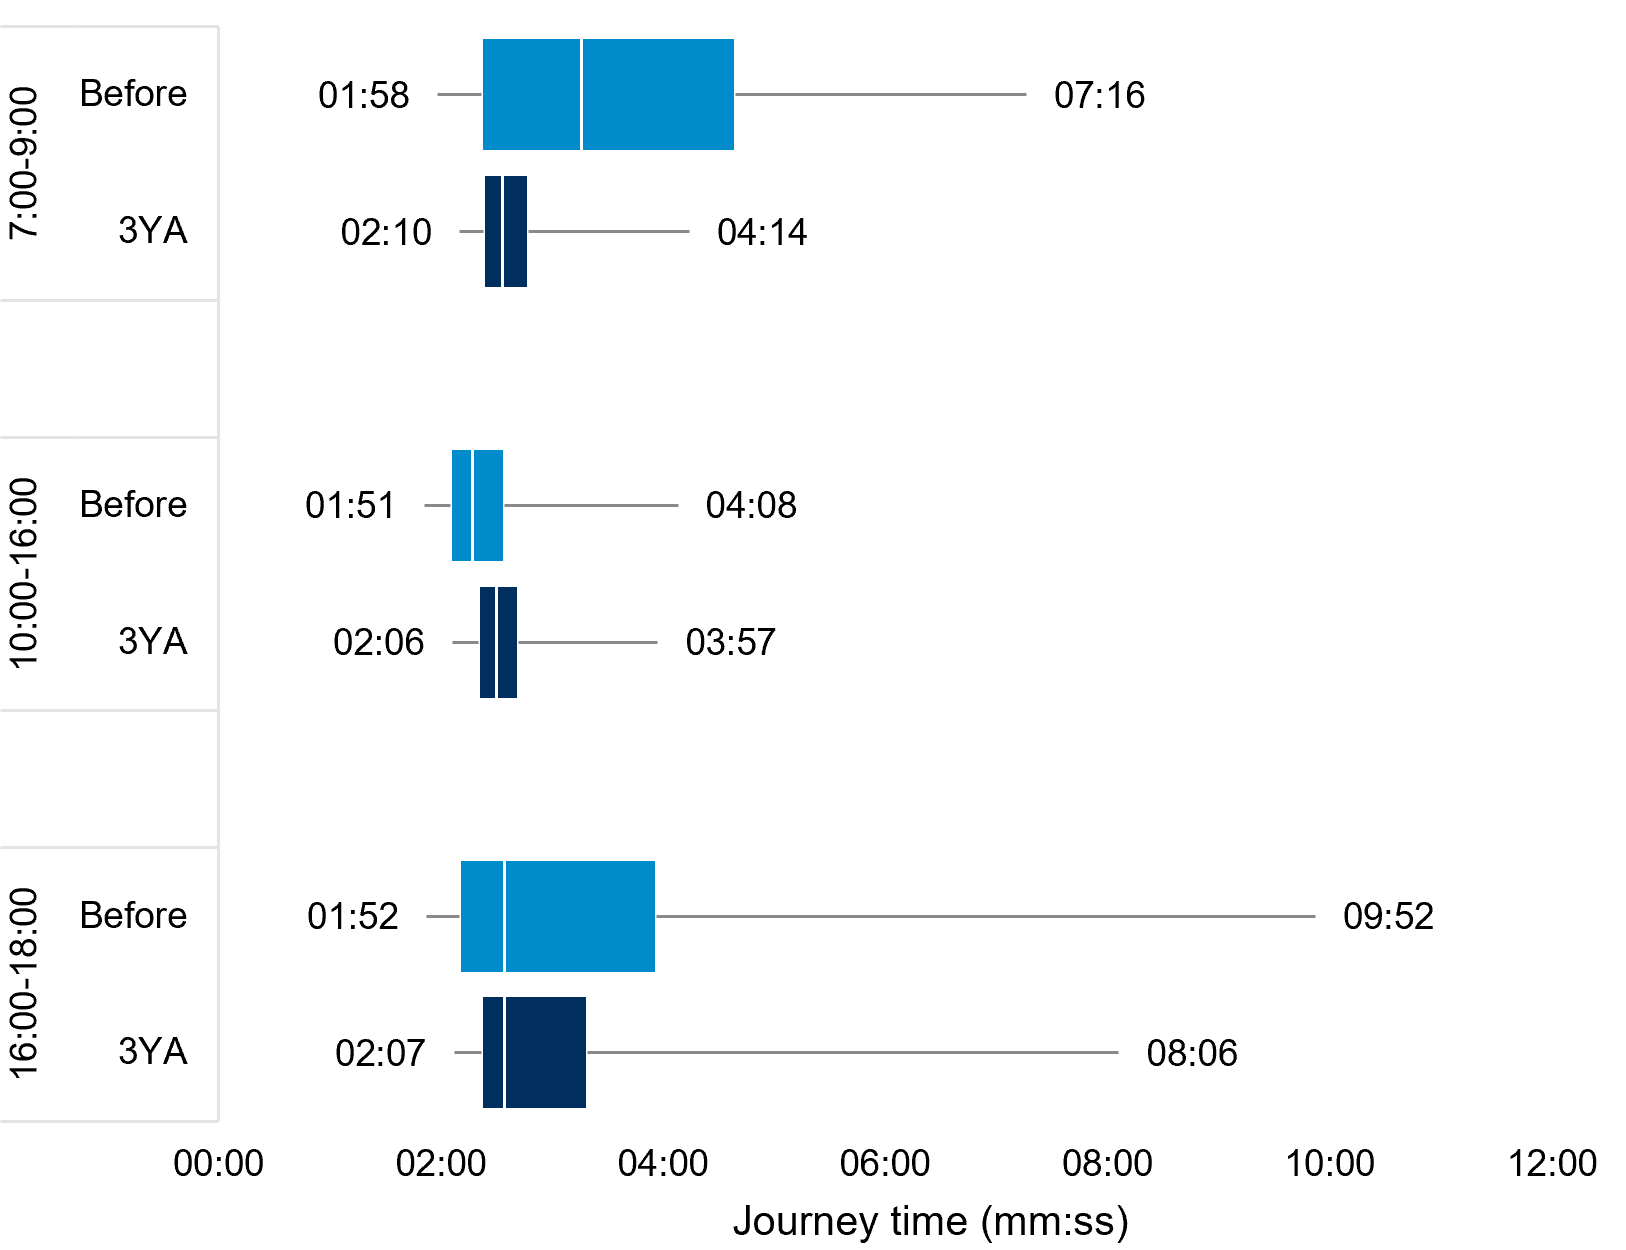
Source: Satellite Navigation (TomTom) and National Highways (NTIS). Before: 2017 and three years after: 2023.
Walking and cycling
How has the project supported active travel?
The project introduced a new shared pedestrian and cycle route alongside the A500, improving connections between surrounding communities, employment areas and local facilities.
Monitoring undertaken as part of the evaluation shows that walking and cycling levels increased following the project's completion, suggesting the new facilities have improved local connectivity and reduced severance. Most users surveyed were satisfied with their journey experience and considered the route to be well connected to the wider walking and cycling network. Some users identified opportunities to improve the route further, particularly through additional lighting.
