Safety
Overview
The evaluation seeks to generate evidence on which key theme areas were the most effective at achieving the objectives and the progress of outcomes. The outcomes in safety, such as collision numbers, collision rates, collision severity and the number of killed or seriously injured casualties were compared to previous years’ collisions rates and the severity of these cases.
The safety objective for this project was to maintain and, where possible, improve current safety standards.
Has the project achieved its safety objectives?
The evaluation has demonstrated that the project is on track to meet its safety objective.
What impact did the project have on collisions?
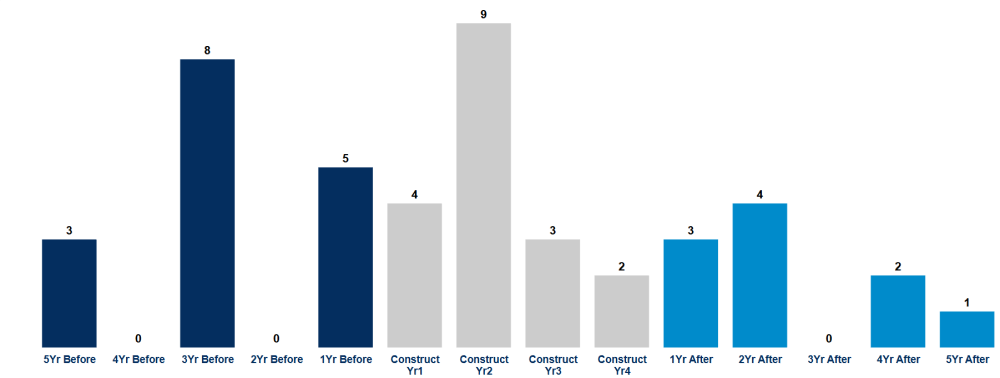
In the five-year period before the project opened there were 16 personal injury collisions, an average number of just over 3 per year. This reduced to an average of 2 per year for the five-year period after the project opened. The figure below shows changes in the number of personal injury collisions before the project, during construction and after opening.
What impact did the project have on collision rates?
The average collision rate was 4.6 personal injury collisions (PICs) per hundred million vehicle miles (hmvm). The five-years after evaluation has shown that the average collision rate had decreased to 2.5 PICs per hmvm.
Do we believe the project has contributed to this change?
As part of the safety evaluation, we look to assess what changes in collision might have occurred due to factors external to the project over this timeframe. We estimate that if the new configuration of the A30 had not occurred, the trend in the number of PICs and collision rates would likely have reduced, but not to the extent to what has been observed.
What impact did the project have on the severity of collisions?
The project has resulted in a severity reduction across all three categories (fatal, serious, slight).
Number of Personal Injury Collisions by severity
| Severity | Before | After | Observed change |
|---|---|---|---|
| Fatal (total) | 1 | 0 | -1 |
| Serious (per year) | 0.83 | 0 | -0.83 |
| Slight (per year) | 2.57 | 2 | 0.57 |
What impact did the project have on killed or seriously injured casualties?
The impact on casualty severity is measured using the number of killed or seriously injured casualties (KSI) and fatal weighted injuries (FWI).
The number of KSI casualties reduced from an average of one before the project opened to zero after opening.
The KSI rate also reduced from an average of 1.8 per hmvm before the project to zero.
Similarly FWI reduced from an average of 0.3 before opening to zero after opening. The FWI rate also reduced from an average of 0.6 hmvm before opening to zero.
Overall, these findings suggest the project is having a positive impact on the severity of casualties within the project extent. However, as serious casualty numbers are low, these results should be interpreted with appropriate caution.
Change on casualties
| Metric | Before | After | Observed change |
|---|---|---|---|
| Killed or seriously injured | 1 | 0 | -1 |
| Killed or seriously injured rate (hmvm) | 1.8 | 0 | -1.8 |
| Fatal weighted injury | 0.3 | 0 | -0.3 |
| Fatal weighted injury rate (hmvm) | 0.6 | 0 | -0.6 |
What impact has the project had on the wider safety area?
We observed fewer PICs across the wider safety area following completion of the project. The number of collisions fell from 288 to 200, while the collision rate reduced from 14.5 to 10.1 PICs per hmvm. Improvements were seen across all collision severities, including KSI and FWI.
We also compared these results with what would have been expected without the project. The analysis indicates that the improvement in collision rates is greater than would be expected from wider road safety trends alone, suggesting the project has contributed to improved road safety.
