Customer journeys
The evaluation seeks to determine the extent to which the project has achieved its objectives and delivered the intended outcomes.
Traffic growth
How did traffic volumes change?
We analysed the changes in traffic volumes on the Catterick South to Leeming section five years after project opening. Traffic volumes increased by 8% in both directions, slightly below the regional and national growth rates of approximately 10% and 13%, respectively.
The A1 is an important part of our road network for freight movement and carried a higher proportion of HGVs than the national average before the project. Five years after opening, the proportion of HGVs had declined slightly, from 23% to 21% in the northbound direction and from 23% to 22% in the southbound direction.
These changes represent a 2% reduction in northbound HGV volumes and a 1% reduction in southbound HGV volumes.
Table 1: Observed changes in average weekly traffic on Catterick South to Leeming by direction
| Direction | 2013 | HGV% | 2023 | HGV% | Difference | % Change | HGV% Change |
|---|---|---|---|---|---|---|---|
| Northbound | 26,400 | 23% | 28,600 | 21% | 2,200 | 8% | -2% |
| Southbound | 25,300 | 23% | 27,300 | 22% | 2,000 | 8% | -1% |
Source: Before (2013) - May 2013, National Highways Webtris data, 5YA (2023) - May 2023 Commissioned Counts Data.
Wider area traffic
Along with widening of the A1, other major enhancements delivered by the Leeming to Barton project included:
- a new road layout to enable the removal of the old A1 exit slip road to Gatherley Road and to accommodate the new local access road (A6055)
- replacement of Fort bridge to accommodate the additional lanes of the A1(M)
- construction of the new grade-separated junction 52 providing access to the A1(M) from the local road network and local access road
We evaluated the project’s impact on traffic across the wider study area, including the A1 section and surrounding local roads. The project aimed to reduce traffic on local roads within the study area, however the analysis showed mixed outcomes.
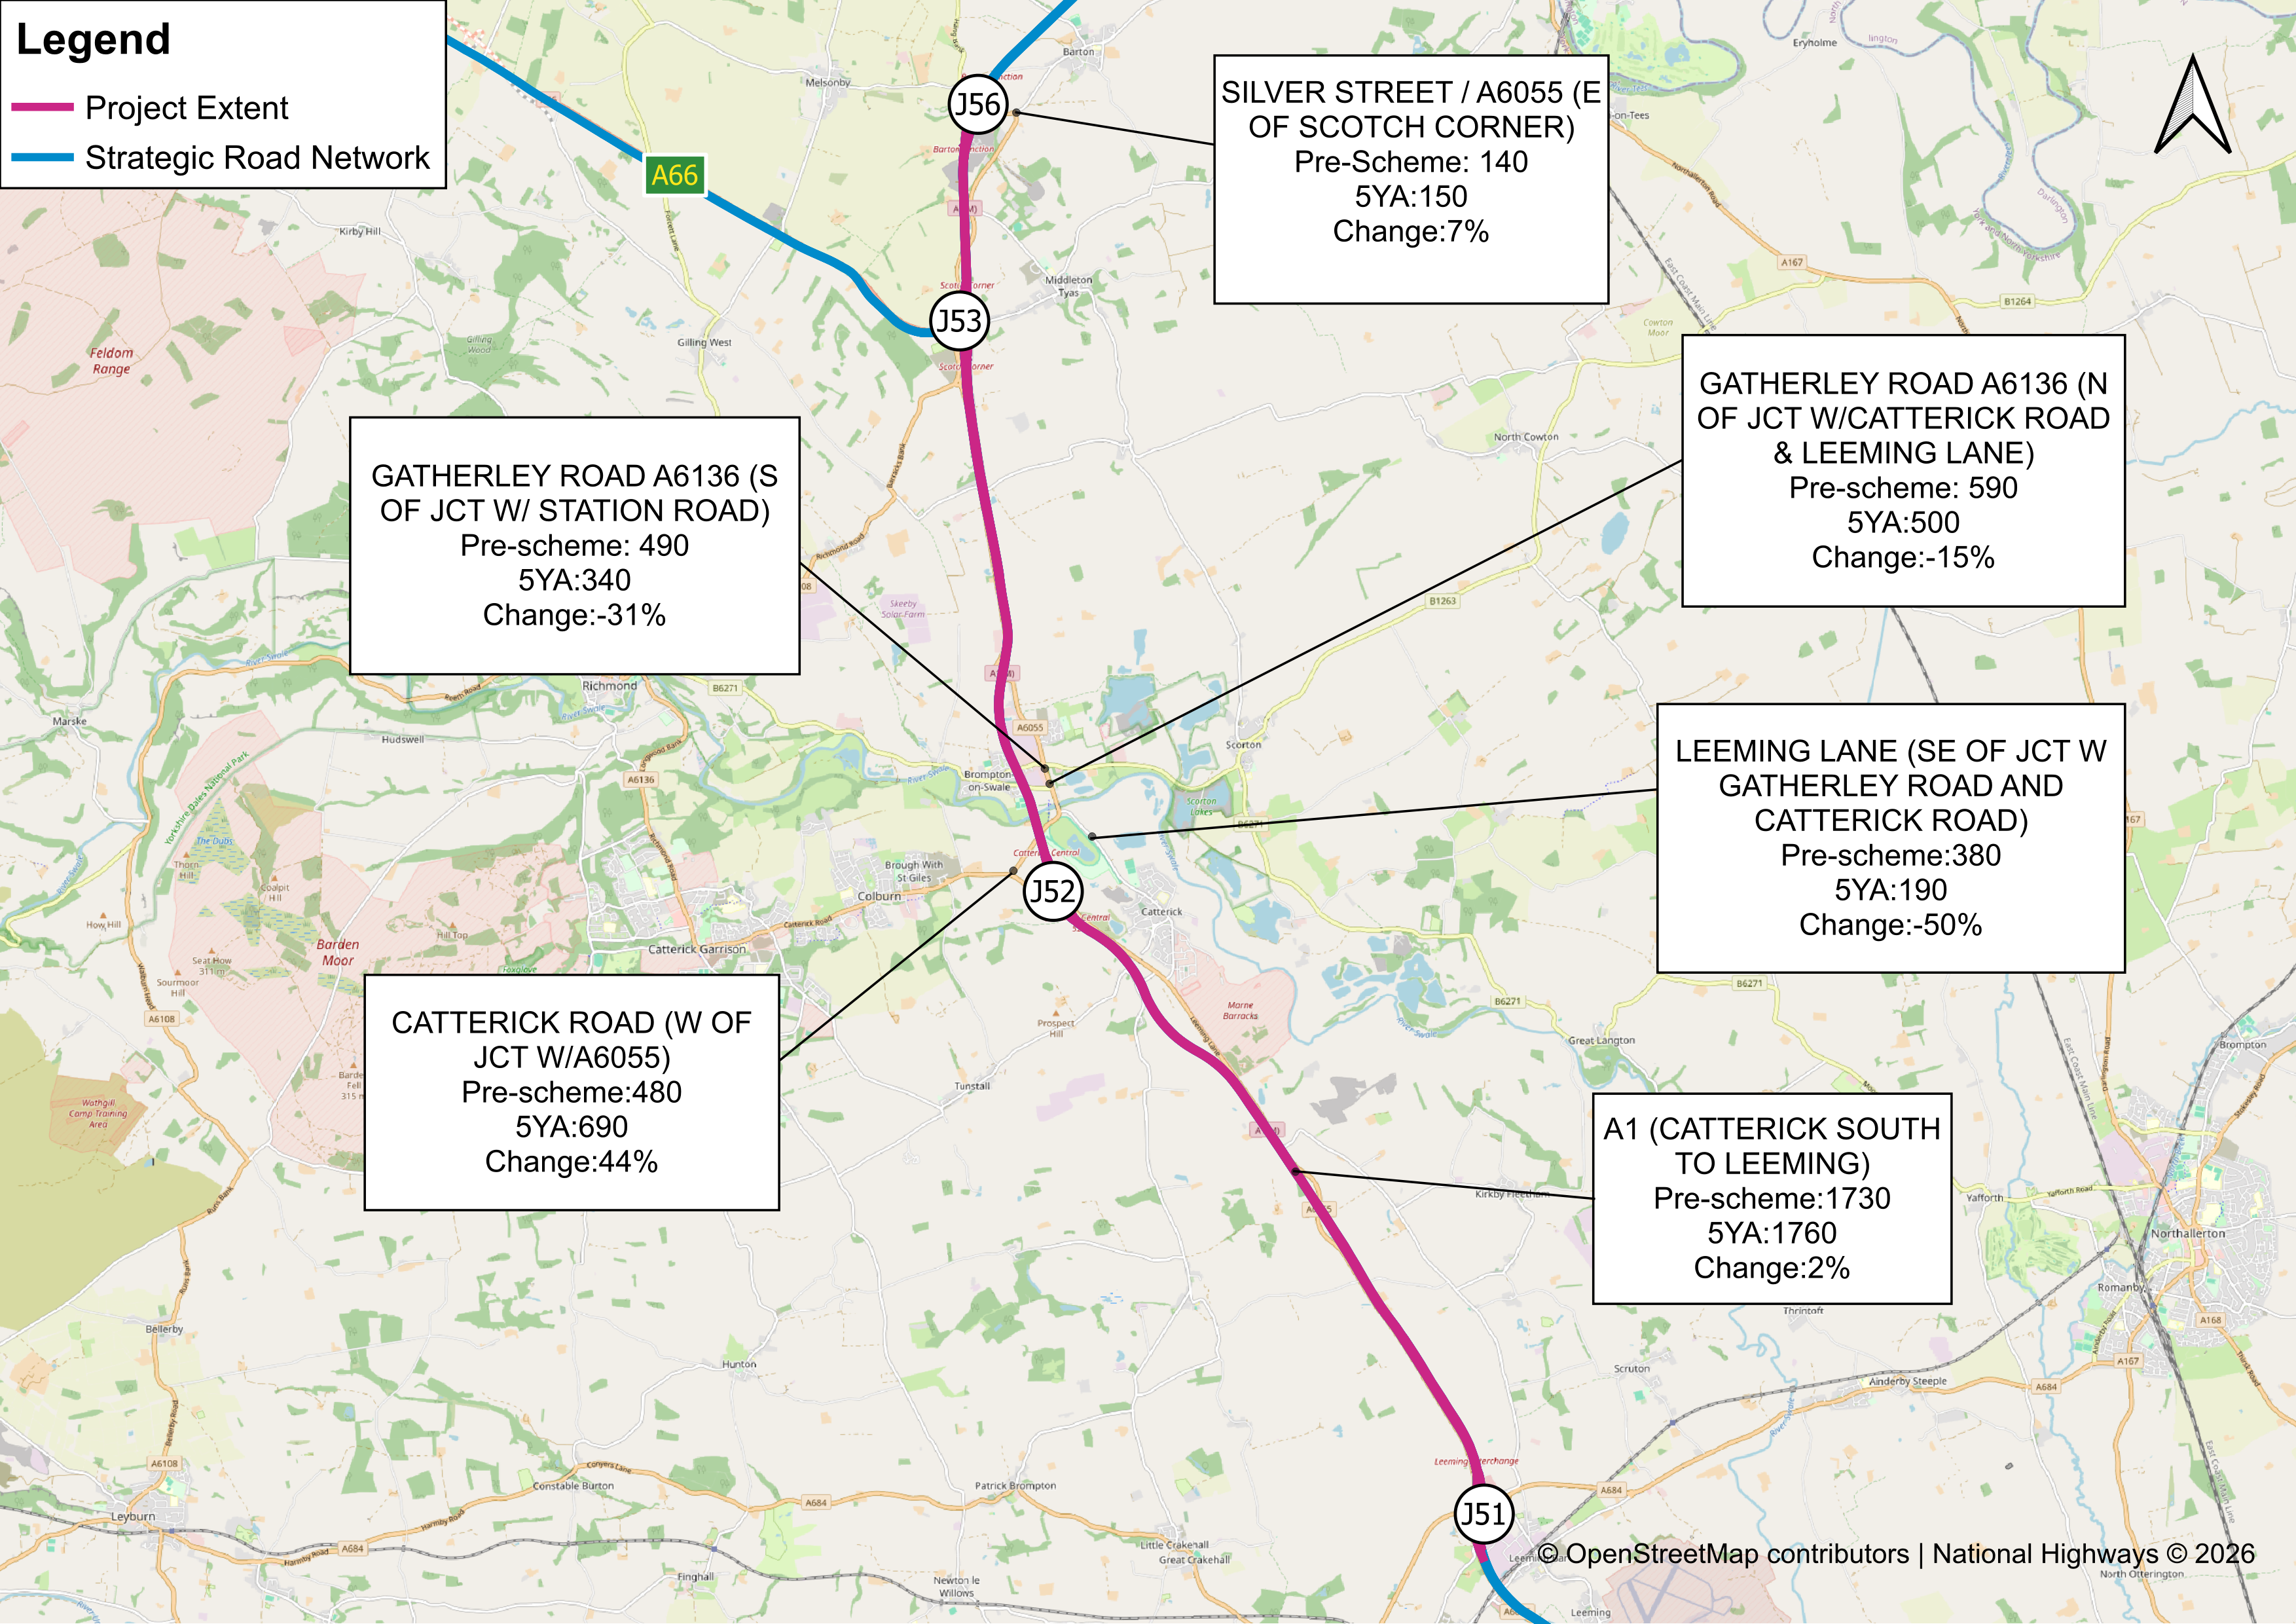
During the morning peak period, traffic volumes reduced on several local roads, including a 22% decrease on Gatherley Road and a 28% reduction on the Leeming Lane. However, notable increases were recorded on some routes, particularly Catterick Road west of Junction 52, where traffic volumes increased by 54% in the morning peak and 44% in the evening peak. Silver Street also recorded a substantial increase of 33% during the morning peak. Most other routes experienced reductions in traffic volumes.
Figure 1: Changes in morning peak volumes in Leeming to Barton Study Area.
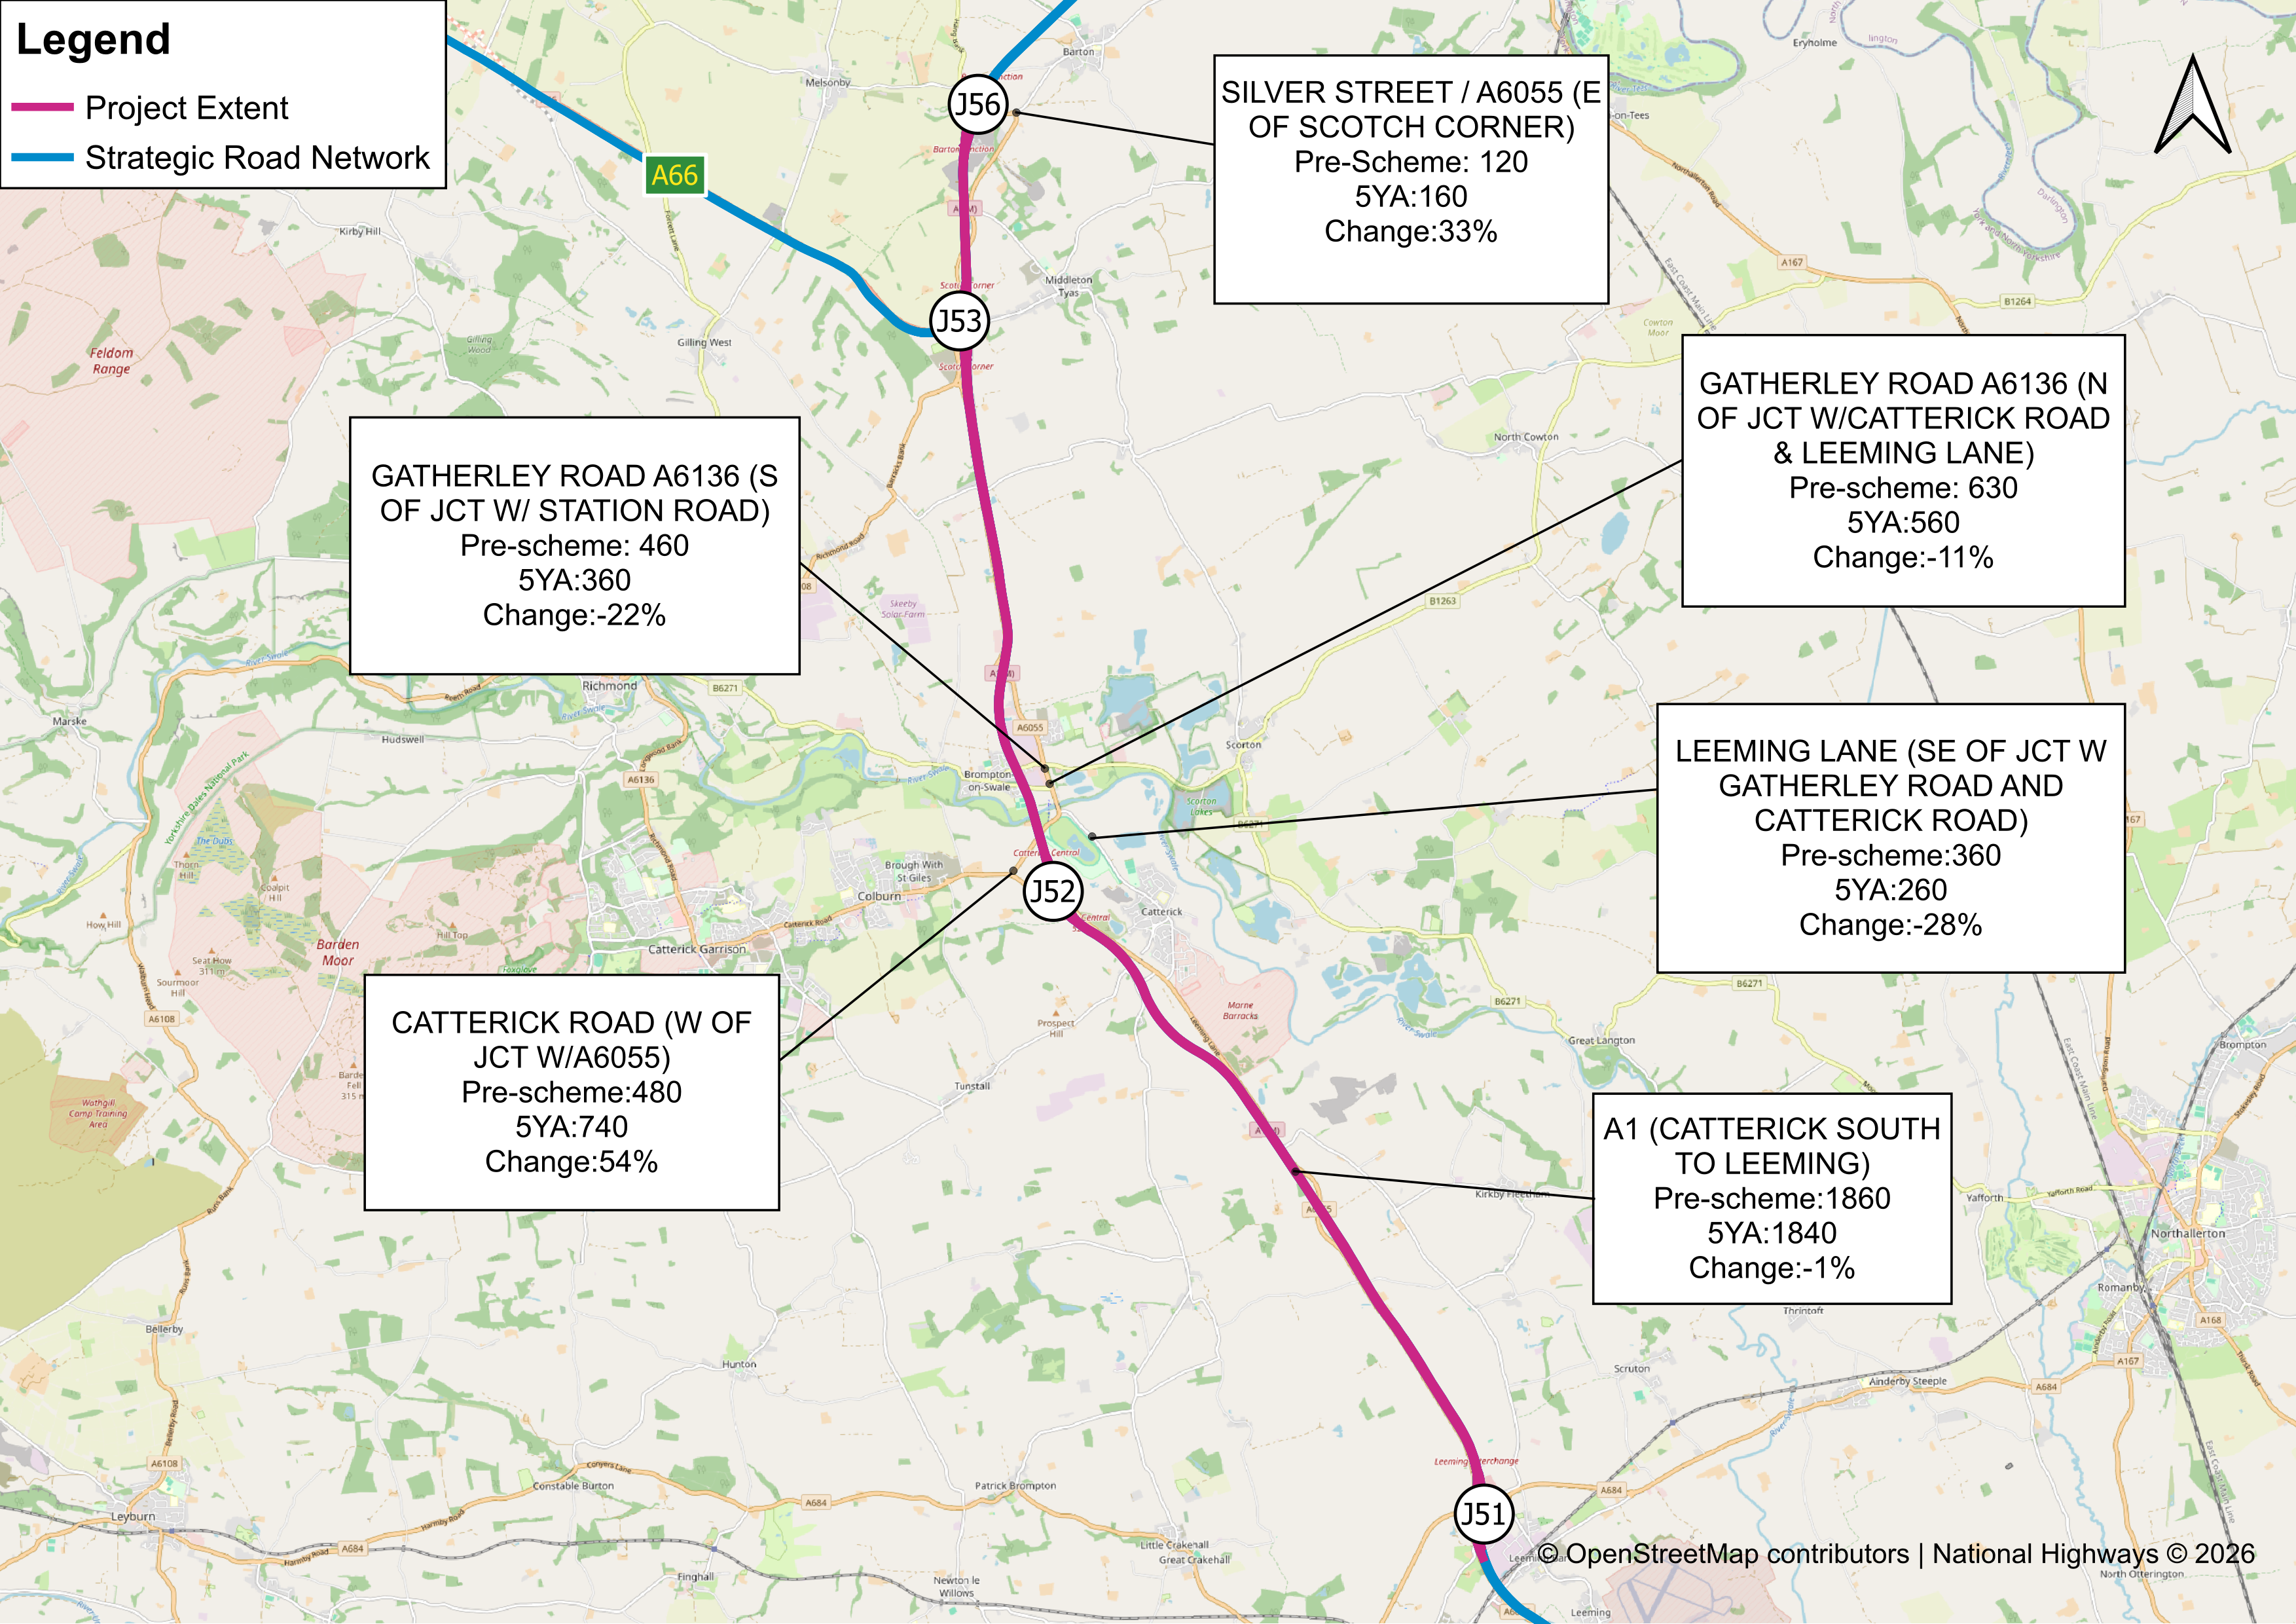
Figure 2: Changes in evening peak volumes in Leeming to Barton Study Area.
Was traffic growth as expected?
To assess whether the traffic growth was as expected, observed traffic changes were compared with those forecast during the appraisal. This comparison was undertaken for the Catterick South to Leeming section, where traffic data was available.
Traffic models are typically considered accurate where the forecast flows are within +/-15% of the observed flows used to validate the model. The analysis indicates that the traffic growth was generally lower than the forecast, suggesting that the appraisal may have overestimated the traffic growth. The largest differences were observed during the morning and evening peak periods. However, the differences between forecast and observed traffic changes were broadly within accepted ranges. Some variations between forecast and observed results may reflect the limitations in the available observed data.
Figure 3: Forecast and observed change
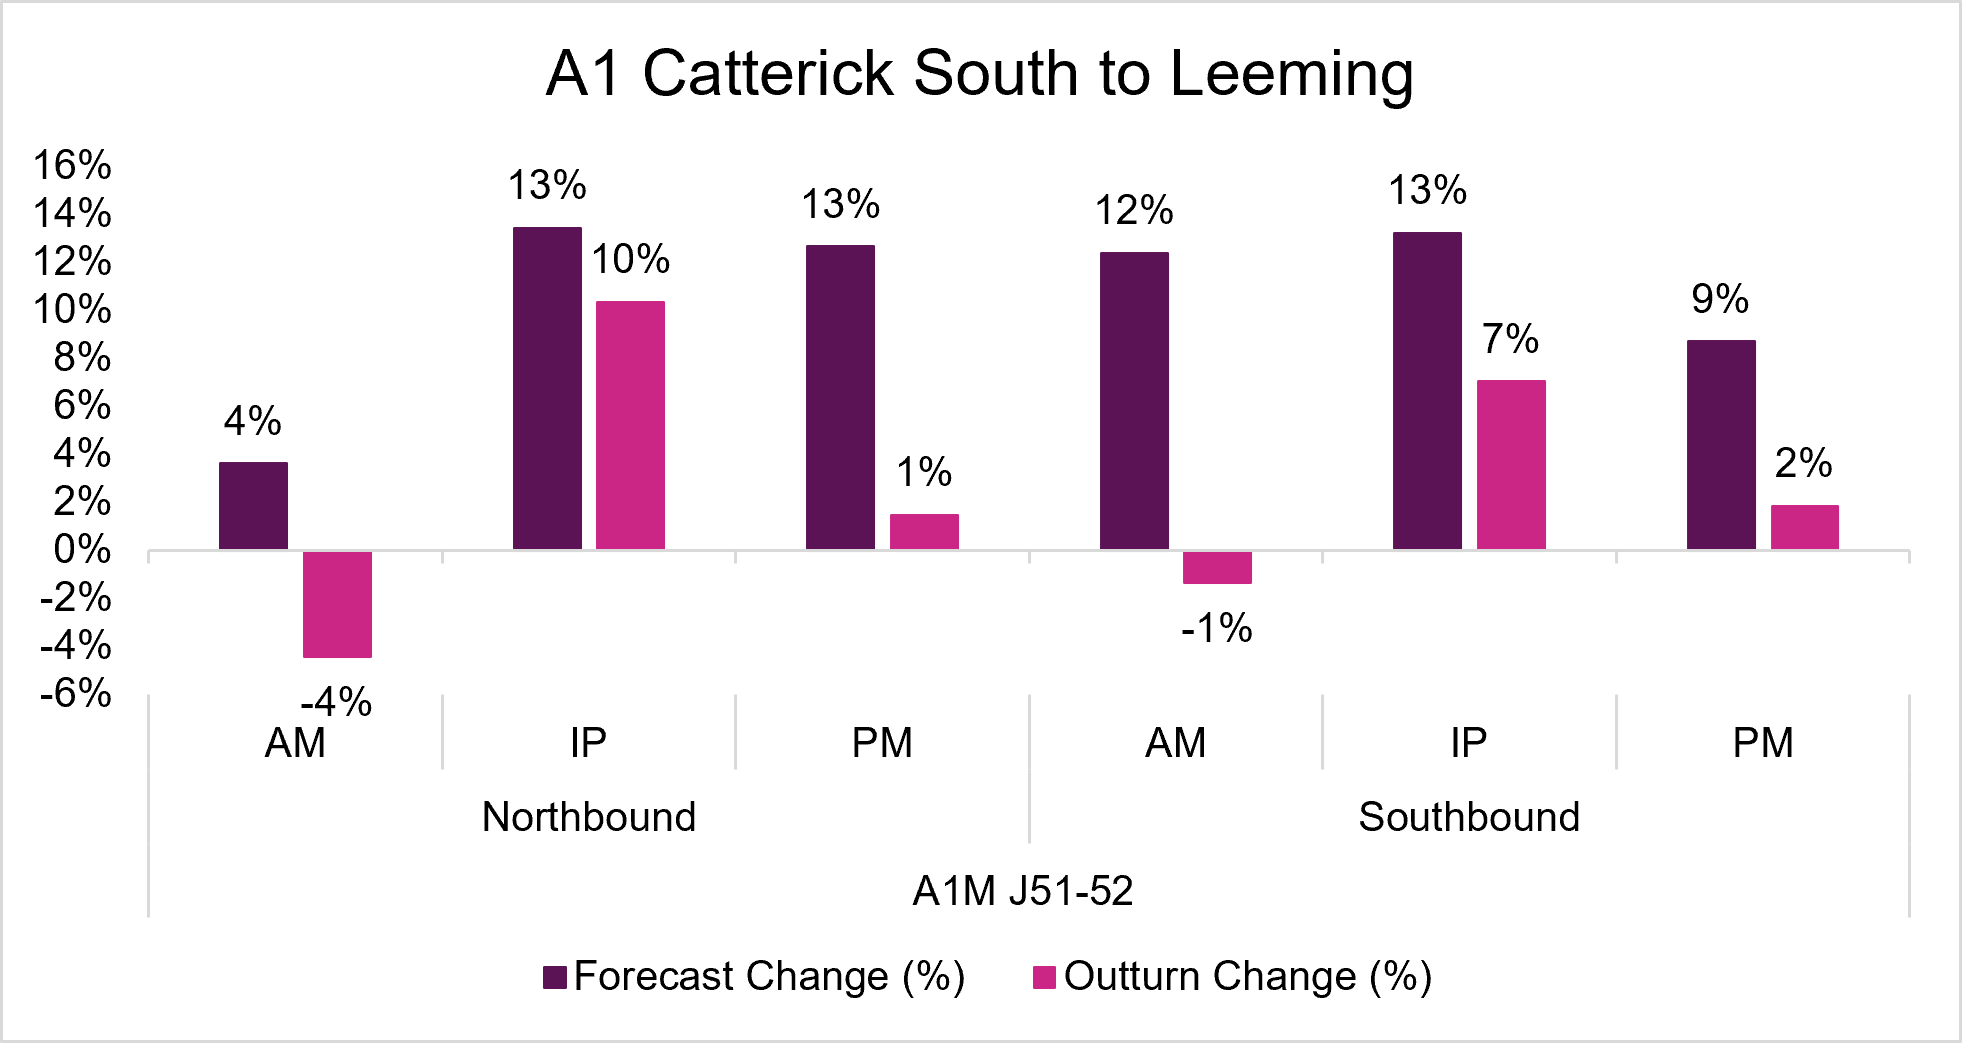
On the local roads, the appraisal expected some traffic to shift to the Strategic Road Network following the project improvements. The observed changes were broadly in line with this expectations, although the reductions in traffic volumes were generally lower than forecast.
Journey time performance
Did the project deliver journey time savings?
One of the objectives of the project was to reduce congestion and enhance journey times along the route. However, because the project involved a carriageway realignment it prevented the provision of satnav data for the pre-construction period. While alternative data sources were considered, inconsistencies in journey time data meant that they were unsuitable for our analysis. Due to this, a direct assessment of the project’s impact on journey time and reliability could not be undertaken. To gain some insight into the potential effects of the project on congestion, the route stress metric was calculated as an alternative indicator.
Journey time reliability
Did the project make journeys more reliable?
The route stress metric is an alternative measure of congestion that involves the calculation of congestion reference flow (CRF). Congestion reference flow is an estimate of the total annual average daily traffic (AADT) flow at which the carriageway is likely to be ‘congested’ in the peak periods.
We calculated the congestion reference flow at locations between A1 Leeming Barton and Scotch Corner where traffic data was available. Route stress is then calculated as the ratio of annual average daily traffic (AADT) to congestion reference flow (CRF).
The table below shows the results of the route stress analysis. The results indicate a route stress value of 75% across the project extent between Junctions 51 and 56. According to DfT guidance, route stress values should fall within the range of 75% to 125%, with values outside this range adjusted to the nearest threshold. The route stress values of 75% displayed in Table 2 indicate uncongested, reliable journeys across the project extent.
Table 2: Route Stress Metric Analysis
| Project section | Route stress |
|---|---|
| Junction 51 to 52 | 75% |
| Junction 52 to 53 | 75% |
| Junction 53 to 56 | 75% |
Source: Commissioned Counts (May 2023).
